Sometimes we want to know right away whether our OpenSearch is running or not. It could be troublesome to execute commands such as systemctl status opensearch every time to check OpenSearch status. With the help of AWS CloudWatch, we can monitor and send an alarm notification to inform us the status of OpenSearch running on our EC2 instance.
目次
Prerequisite
- AWS CLI must be installed on your EC2 instance server.
You can install AWS CLI with the following command if you haven’t already. For more information click here.
123$ curl "https://awscli.amazonaws.com/awscli-exe-linux-x86_64.zip" -o "awscliv2.zip"$ unzip awscliv2.zip$ sudo ./aws/install - IAM role with the permission of ‘CloudWatchAgentServer’ must be attached to your EC2 instance running OpenSearch.
- OpenSeach is installed on your EC2 instance server.
Steps
Prepare Scripts on EC2 Instance Server
Step 1
Login to the server running OpenSearch and create a new folder.
|
1 |
$ sudo mkdir /bashcripts |
Step 2
Navigate to folder.
|
1 |
$ cd /bashcripts |
Step 3
Create 3 files: instance-id, instance-id.sh, opensearch-monitor.sh.
These files will contain the scripts to send necessary information of OpenSearch status to CloudWatch.
|
1 |
$ touch instance-id instance-id.sh opensearch-monitor.sh |
Step 4
Make the .sh files executable.
|
1 |
$ chmod a+x *.sh |
Step 5
Edit instance-id.sh file with vim or any editors.
|
1 |
$ sudo vim instance-id.sh |
Add the following code as it is and save.
|
1 2 |
#!/bin/bash curl http://169.254.169.254/latest/meta-data/instance-id |
The 169.254. 169.254 IP address is a “magic” IP in the cloud world, in AWS it used to retrieve user data and instance metadata specific to a instance.
In this case, the code will curl the instance id of our OpenSearch server.
Step 6
With the help of cron, the instance-id.sh file will be run and the instance id will be added to instance-id file – which later will be used by opensearch-monitor file.
To do so open cron table.
|
1 |
$ sudo crontab -e |
Let cron run this script everytime the EC2 instance reboots. Add the following command and save.
|
1 |
@reboot /bin/bash /bashcripts/instance-id.sh > /bashcripts/instance-id |
Step 7
Edit opensearch-monitor.sh file
|
1 |
$ sudo vim opensearch-monitor.sh |
Step 8
Add this scripts to opensearch-monitor.sh file.
Option 1
・opensearch.pid file exists only when OpenSearch is active or running.
・The
checkOpenSearchStatus function verifies whether OpenSearch is running by checking the existence of the opensearch.pid file.
・When this file is run it will create new metric and namespace in CloudWatch and send the value of 0 if OpenSearch status is active (running) and 1 if OpenSearch status is inactive (dead).
|
1 2 3 4 5 6 7 8 9 10 11 12 13 14 15 16 17 18 19 20 21 22 23 24 25 |
#!/bin/bash #set -x INSTANCE_ID=$(cat /bashcripts/instance-id) # check if opensearch.pid exists checkOpenSearchStatus() { status_file="/var/run/opensearch/opensearch.pid" if [ -f "$status_file" ]; then echo "" else echo "1" fi } status=$(checkOpenSearchStatus) # returns 0 if active, 1 if non-active if [ "$status" == "" ] then aws --region ap-northeast-1 cloudwatch put-metric-data --metric-name opensearch_status --value 0 --namespace opensearch_status --dimensions InstanceId=$INSTANCE_ID else aws --region ap-northeast-1 cloudwatch put-metric-data --metric-name opensearch_status --value 1 --namespace opensearch_status --dimensions InstanceId=$INSTANCE_ID fi |
Option 2
・If somehow .pid file doesn’t exist, you can use the following function as a workaround.
・The
checkOpenSearchStatus function will run a commands to check if OpenSearch is in active state.
|
1 2 3 4 5 6 7 8 9 10 11 12 13 14 15 16 17 18 19 20 21 22 |
#!/bin/bash #set -x INSTANCE_ID=$(cat /bashcripts/instance-id) #returns 0 if active, 1 if non-active checkOpenSearchStatus() { if sudo systemctl is-active --quiet opensearch; then echo "" else echo "1" fi } status=$(checkOpenSearchStatus) if [ "$status" == "" ] then aws --region ap-northeast-1 cloudwatch put-metric-data --metric-name opensearch_status --value 0 --namespace opensearch_status --dimensions InstanceId=$INSTANCE_ID else aws --region ap-northeast-1 cloudwatch put-metric-data --metric-name opensearch_status --value 1 --namespace opensearch_status --dimensions InstanceId=$INSTANCE_ID fi |
Step 9
With the help of cron, we can run this script every one minute.
Let’s open cron table again.
|
1 |
$ sudo crontab -e |
Add the following line below to run opensearch-monitor.sh every one minute.
|
1 |
* * * * * /bin/bash /bashcripts/opensearch-monitor.sh |
Racap: now your crontab should look something like this.
|
1 2 3 |
PATH="/usr/local/bin:/usr/bin:/bin" @reboot /bin/bash /bashcripts/instance-id.sh > /bashcripts/instance-id * * * * * /bin/bash /bashcripts/opensearch-monitor.sh |
Note:
PATH="/usr/local/bin:/usr/bin:/bin" is to help cron know which command to use.
This line is optional if cron run your file as expected.
Step 10
Restart EC2 instance server.
If it’s not possible to restart your instance you can run this command manually.
/bin/bash /bashcripts/instance-id.sh > /bashcripts/instance-id
Step 11
Let’s check if our cron working correctly.
Go to /bashcripts, view the instance id file.
|
1 2 |
$ cd /bashcripts $ cat instance-id<span style="font-weight: 400;">if it outputs the instance id.</span> |
It should outputs the instance id like the following.
![]()
View CloudWatch Metrics
Step 12
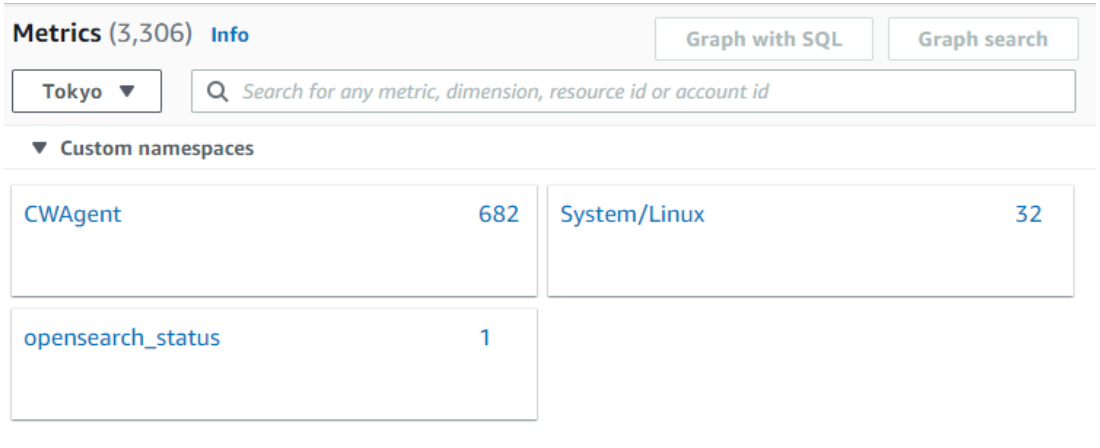
On AWS console go to CloudWatch. Click on ‘All metrics’ and the opensearch_status should be appear under custom namespaces.
Step 13
Click opensearch_status, click InstanceId, tick your instance.

Step 14
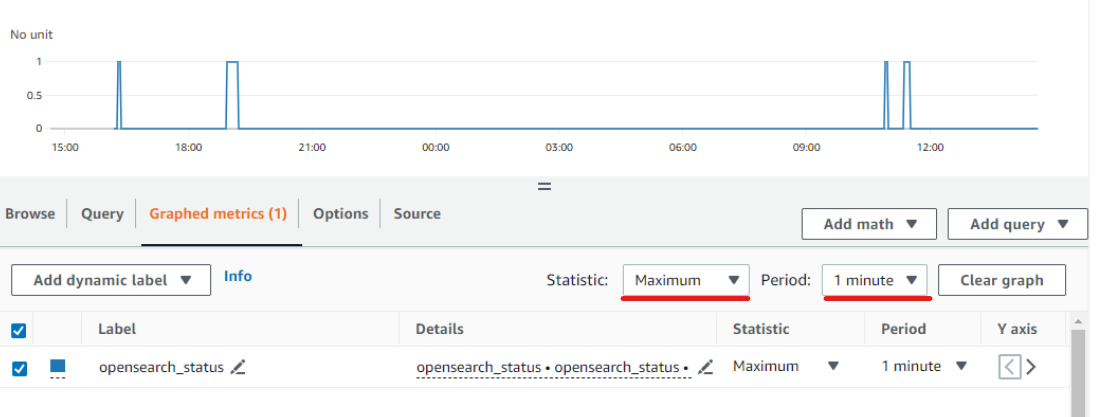
Click ‘Graphed metrics’ tab. Set the following parameters.
Static: Maximum
Period: 1 minute
Try to stop and start OpenSearch with the following commands.
|
1 2 3 |
$ sudo systemctl status opensearch $ sudo systemctl stop opensearch $ sudo systemctl start opensearch |
Your ‘Graphed metrics’ should look like this.
Note that it may take up to 5 minutes for CloudWatch to display the updated metrics, so the graph might not appear immediately.
Create and Setup Alarm to Monitor OpenSearch Status
Step 15
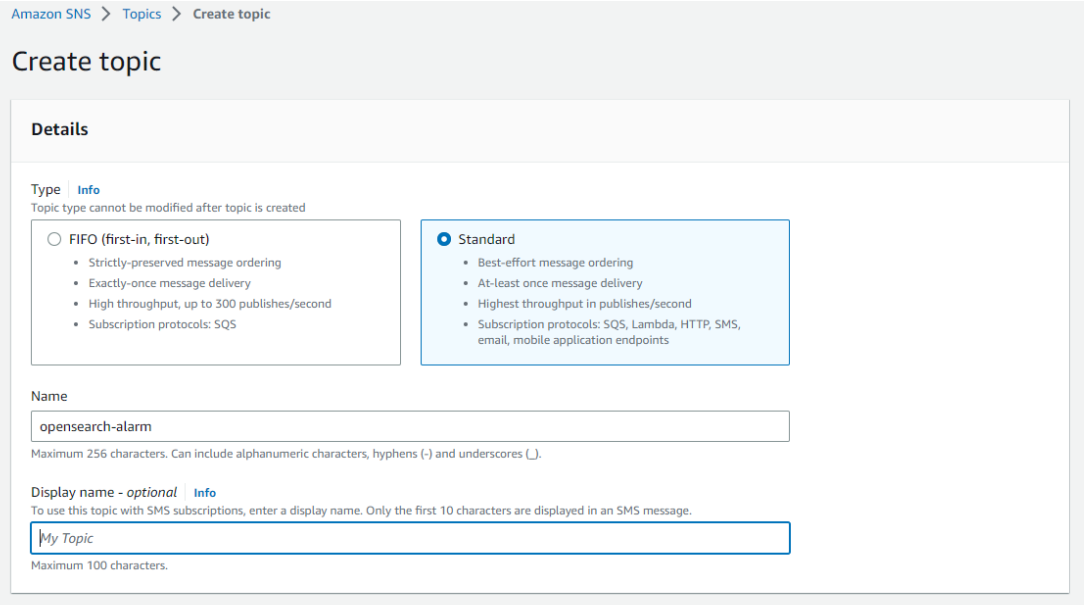
Create an SNS topic.
Step 16
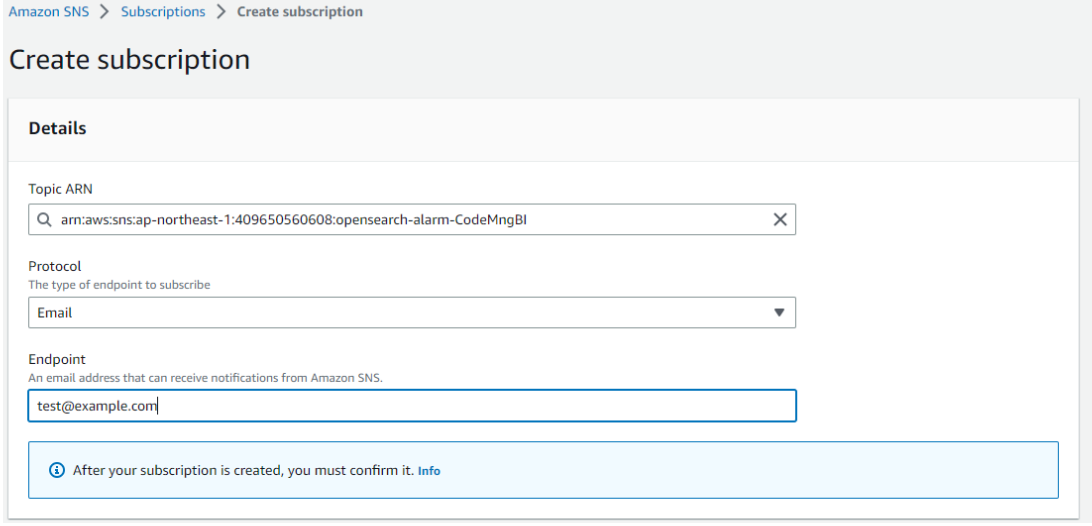
This time, I chose email protocol to send notifications, however feel free to chose any protocol according to your needs.
Check your email inbox and don’t forget to confirm your subscription.
Step 17
Let’s create an alarm. Go to CloudWatch, click Alarm > All alarms > Create Alarm.
You should see this setting page. Then click Select metric > opensearch_status > InstanceId > (your instance) .

Step 18
For metric, set as following.
Statistic: Maximum
Period: 1 minute
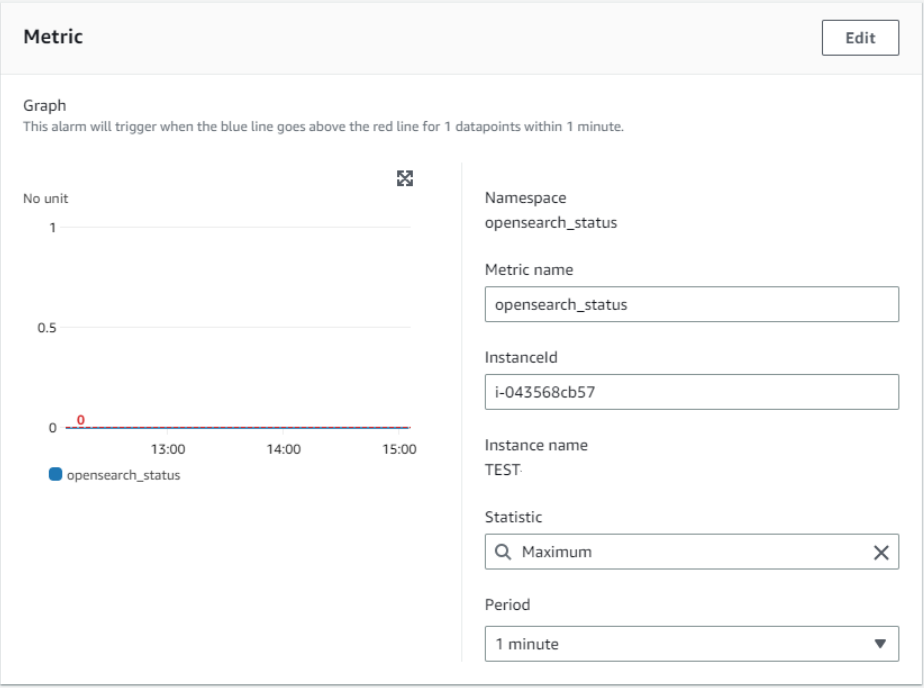
For conditions, set as the following.
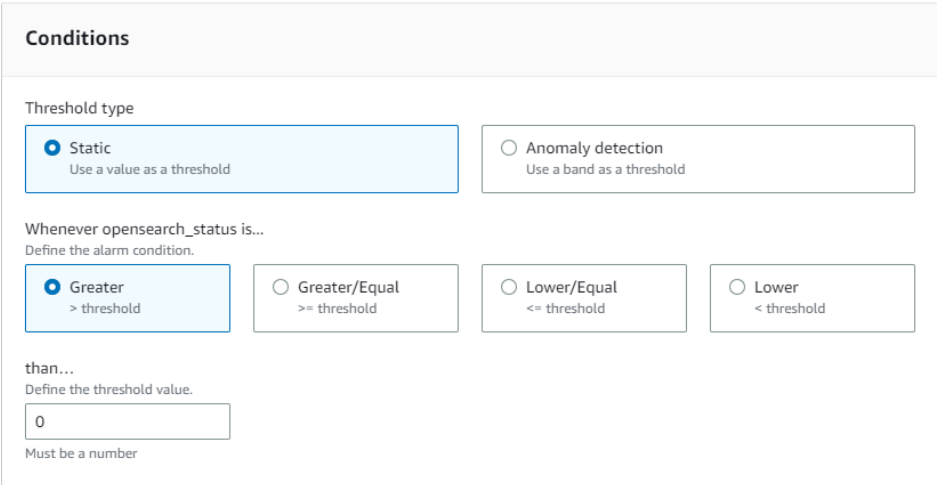
Step 19
Notification settings.
This will send notification to the SNS topic we created earlier when in alarm state is triggered.
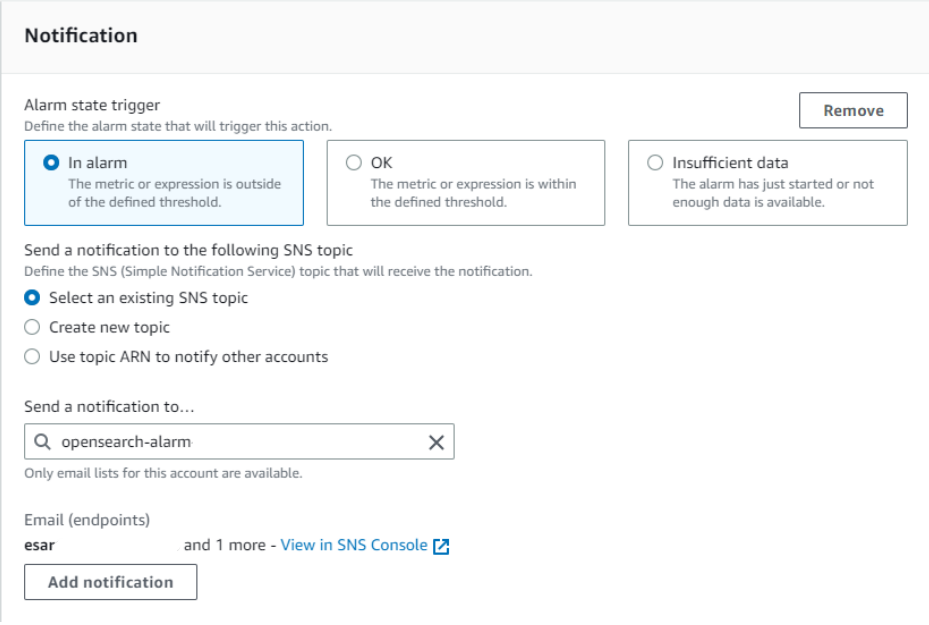
It’s recommended to also set notification when alarm is back to OK state. To do so click ‘Add notification’ and set like the following.
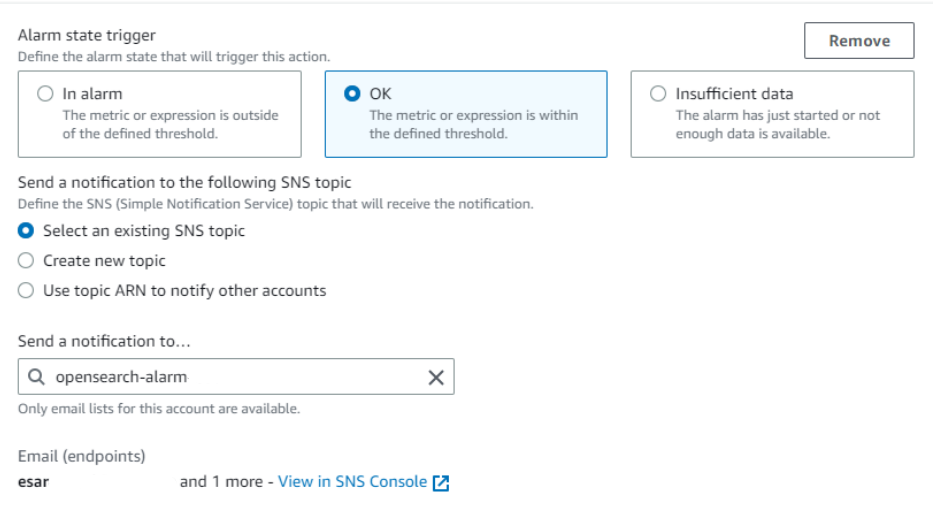
Step 20
Set your alarm name and description. Note the Alarm name can’t be change after creation. To change alarm name you must delete the alarm and create the new one.
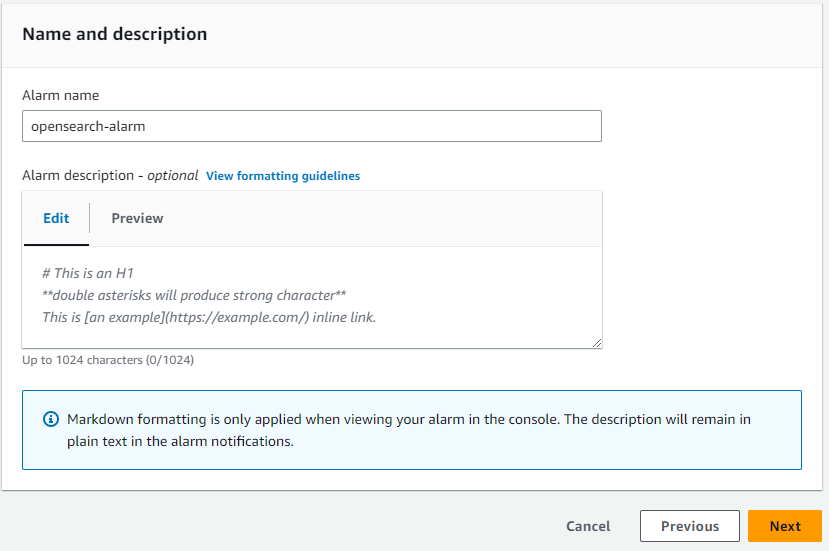
Click next, preview and create alarm.
The alarm will be created and will trigger if the OpenSearch service fails.
Conclusion
With the help of CloudWatch and cron, we can monitor our OpeSearch status running on EC2 instance and automate sending notification when the service fails.
Althought this article is specifically for OpenSearch, this method is also applicable for any other processor monitoring.
- 中級figma教室 - 2024-12-24
- おすすめガジェット紹介!2024年12月編 - 2024-12-21
- Amazon ConnectでNGワードをリアルタイムに検知してSlackに通知する - 2024-12-16
- AWS Amplify AI KitでAIチャットアプリを爆速で作ってみる - 2024-12-14
- AWS LambdaをC#で実装する(ついでにラムダ式を書く) - 2024-12-09
【採用情報】一緒に働く仲間を募集しています


